 Today, IO education policy fellow Stephen Dyer will be testifying before the House Finance Subcommittee to discuss Innovation Ohio’s latest analysis: The school funding squeeze.
In this analysis we examine how over ten years of income tax cuts and funding increases for charter schools have squeezed valuable public education dollars in Ohio. Here are just a few of the key points:
Today, IO education policy fellow Stephen Dyer will be testifying before the House Finance Subcommittee to discuss Innovation Ohio’s latest analysis: The school funding squeeze.
In this analysis we examine how over ten years of income tax cuts and funding increases for charter schools have squeezed valuable public education dollars in Ohio. Here are just a few of the key points:
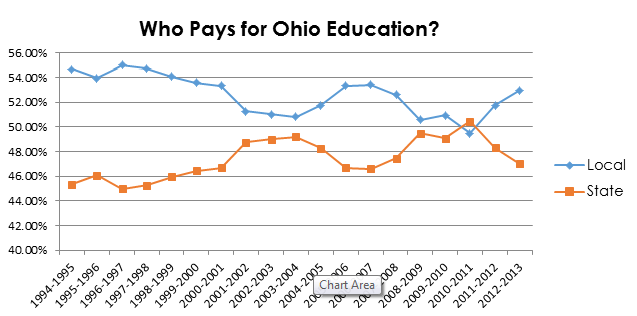
1. Over the last ten years, Ohio has been investing up to $3 billion annually in tax cuts for the rich instead of high-quality schools for our students. 2. Since 2011, state aid has dropped below 50 percent with local revenue now paying for the majority share of the public education funding mix. 3. When factoring in lost revenue to charter schools, education spending as a share of the budget drops to a historic low of 23 percent. 4. In the 2016-17 budget proposal, the percentage of local school districts that face funding cuts jumps from 51 to 67 percent when subtracting the revenue that goes to charter schools. 5. In too many cases, state funding to charter schools reduces the amount of the total per-pupil funding available to students in local public schools, even with their local revenue.Read the full analysis: IO Analysis – The School Funding Squeeze 3-5-15
 Read the full analysis: