Innovation Ohio Facebook Innovation Ohio Twitter Innovation Ohio Instagram

Stephen Dyer · August 23, 2013

New school report cards offer positive changes

The state’s new report card is out now, and there are some positive changes to the format. While many of the aspects of the report card continue to emphasize relatively raw test scores, which are notoriously predicted by demographics, there are new measures that for the first time de-emphasize the importance of demographics on school performance.
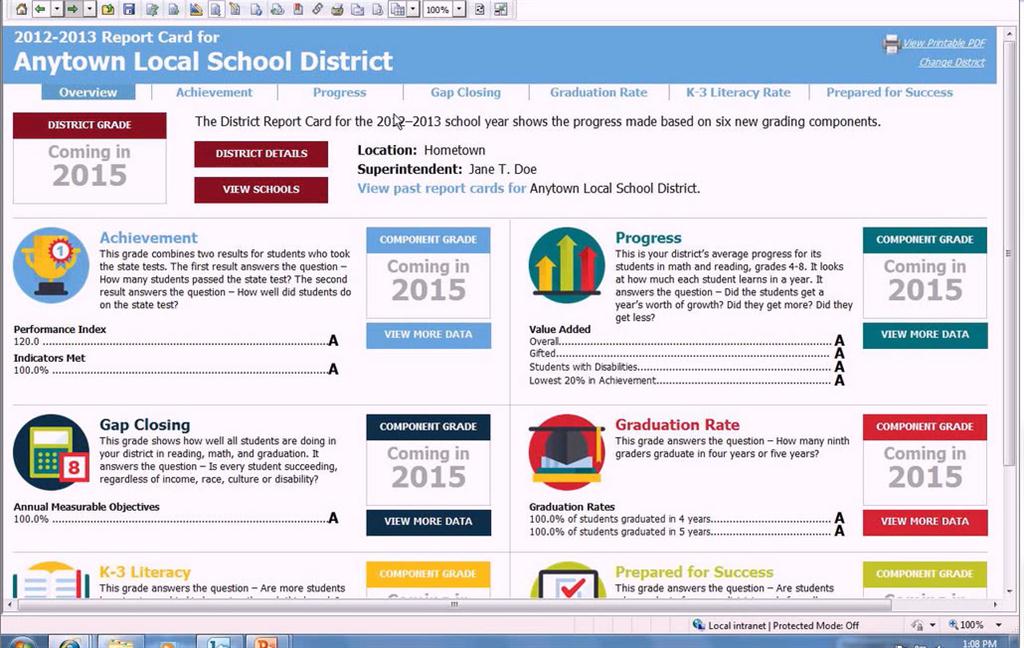
newreportcard
mock-up of new report card
The most obvious are the categories looking at how gifted students, special education students and the lowest performing students grow in a district. These measures illuminate for the first time whether schools have served the extremes in their populations — the very talented as well as the very challenging. What you’ve seen is traditionally high performing districts, like Hudson in Summit County are not doing as good a job at growing their most struggling students. Meanwhile, places like Barberton — a non-major urban district in Summit County — do a better job. There remain questions about how the calculation is made. For example, the struggling performers measure looks at the bottom 20% of performers. However, those performers may have much higher scores in traditionally high performing districts like Hudson than places like Barberton. So measuring growth in that category will be harder to achieve in the former compared to the latter. Speaking hypothetically, if the bottom 20% of children in Barberton go from a 40 to a 60, while in Hudson they go from a 70 to 80, it is difficult to say which district has done a better job, even though Barberton has delivered twice the improvement. But the fact the state is even looking at this is a very positive change. The next challenge will be how to weight these various grades across the criteria to give an overall grade to a district or school building. Traditionally low-performing districts actually do better than the higher performers on these new measures of achievement at the extremes of talent. So will those measures be given greater weight and turn the evaluations on their head? Or will the more traditional, raw test score measures receive a greater weight, favoring wealthier and traditionally high-performing districts? Time will tell. But we at Innovation Ohio are encouraged that the state’s new Report Card provides a more complete, yet complicated and somewhat murky picture of student performance. Because that is much closer to the reality of student performance than pure test scores.

Related Content