What you need to know about Ohio Politics and Policy


The Proper Perspective: Viewpoints on Ohio Education
 “The Proper Perspective” is a discussion between Jamie Davies O’Leary, senior Ohio policy analyst for the Thomas B. Fordham Institute, and Stephen Dyer, education policy fellow at Innovation Ohio. This joint effort was hatched one afternoon after Jamie and Steve had a lively back-and-forth over email about (what else?) charter school data. Interested in many of the same data points and research questions, they decided to share some of this exchange more publicly, helping both to illuminate trends in Ohio public education and formulate policy recommendations through their insights.
In some areas, they’ll find opportunities to coalesce, and even celebrate. In a state often divided vehemently on public education, there’s value in finding alignment with those you may have disagreed with previously.
In other areas, interpretation of the same facts is bound to diverge. That’s OK. We’ll strive for thoughtful dialogue—backed up with research and data—rather than ad hominem attacks or the same ideological shouting that has marked Ohio’s education reform debate for too long. Thanks for joining us and for listening—to both of us. We hope it will be both entertaining and enlightening.
“The Proper Perspective” is a discussion between Jamie Davies O’Leary, senior Ohio policy analyst for the Thomas B. Fordham Institute, and Stephen Dyer, education policy fellow at Innovation Ohio. This joint effort was hatched one afternoon after Jamie and Steve had a lively back-and-forth over email about (what else?) charter school data. Interested in many of the same data points and research questions, they decided to share some of this exchange more publicly, helping both to illuminate trends in Ohio public education and formulate policy recommendations through their insights.
In some areas, they’ll find opportunities to coalesce, and even celebrate. In a state often divided vehemently on public education, there’s value in finding alignment with those you may have disagreed with previously.
In other areas, interpretation of the same facts is bound to diverge. That’s OK. We’ll strive for thoughtful dialogue—backed up with research and data—rather than ad hominem attacks or the same ideological shouting that has marked Ohio’s education reform debate for too long. Thanks for joining us and for listening—to both of us. We hope it will be both entertaining and enlightening.
**********************************************************************************************************************
A decade of performance gains: What does it mean? In the last ten years, Performance Index scores have improved across the board in Ohio’s traditional and charter sectors. Some charters and districts have shown radical improvement. Others have stagnated, and a few have seen a drop. But overall, it appears that Performance Index scores—a measure of achievement in tested grades and subjects—are rising, which means that schools and districts are improving and that our accountability system is headed in a good direction. Here are a few data points. Districts- In the ten school years between 2004–2005 and 2013–2014, districts saw a 6.8 percent increase in their Performance Index scores, from 92.80 to 99.10.
- Of the 610 districts that received Performance Index scores in each of the school years, only twenty-three (or 3.8 percent) saw a drop in scores.
- Big 8 urban districts improved by more than 10 percent, which was greater than districts overall.
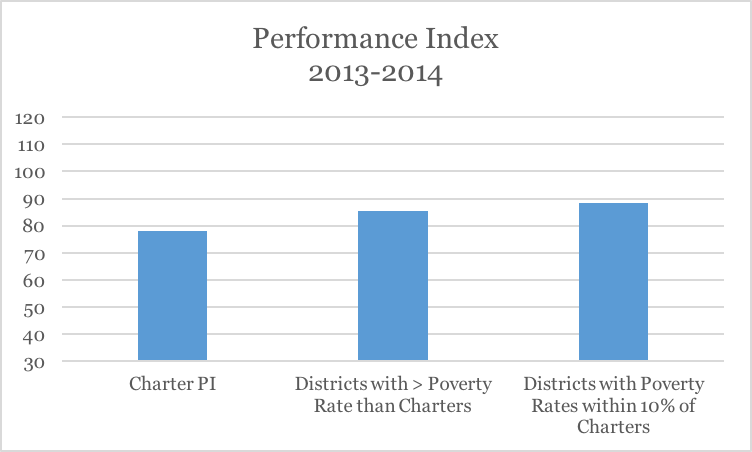
- Big 8 urban districts have a 3.4 percent higher score, with a 6 percent higher poverty rate than charters.
- In the ten school years between 2004–2005 and 2013–2014, charters saw a 45.5 percent increase in their Performance Index scores, from 53.65 to 78.06.
- This improvement was achieved despite the average poverty rate jumping from 64.5 percent to 82.2 percent.
- Of the hundred charters that received Performance Index scores in each of the school years, 14 percent saw a drop in scores.
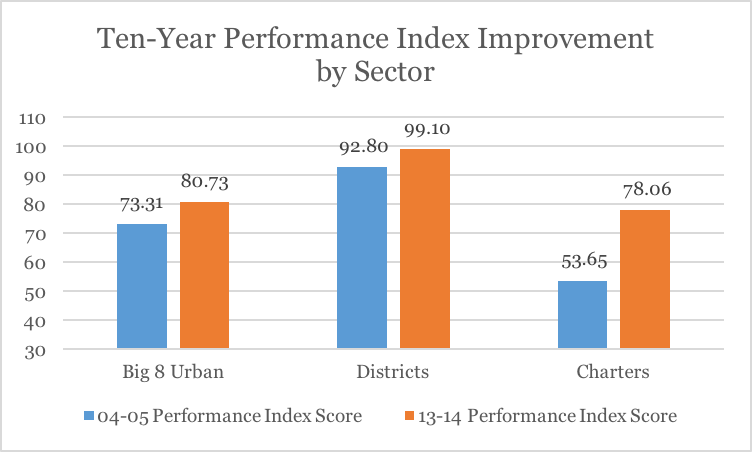
Performance Index scores range from 0 to 120.
**********************************************************************************************************************
 Jamie Davies O’Leary
Senior Ohio Policy Analyst, The Thomas B. Fordham Institute
Jamie Davies O’Leary
Senior Ohio Policy Analyst, The Thomas B. Fordham Institute
**********************************************************************************************************************
 Stephen Dyer
Education Policy Fellow, Innovation Ohio
Stephen Dyer
Education Policy Fellow, Innovation Ohio
 However, despite the many complaints from me and my friends about the state’s test-heavy accountability system, it is producing some impressive results … on test scores. Other important outcomes like critical thinking, creativity and love of learning remain unassessed.
We can also see how far we still have before our charter school sector provides the kind of systemic quality our kids deserve, reinforcing the urgency of remaining on the quality-based track the state has recently adopted.
However, despite the many complaints from me and my friends about the state’s test-heavy accountability system, it is producing some impressive results … on test scores. Other important outcomes like critical thinking, creativity and love of learning remain unassessed.
We can also see how far we still have before our charter school sector provides the kind of systemic quality our kids deserve, reinforcing the urgency of remaining on the quality-based track the state has recently adopted.
Tagged in these Policy Areas: K-12 Education