What you need to know about Ohio Politics and Policy


Ohio’s Troubling Achievement Gap: Charter Schools Make it Worse

- Despite making up 8% of all Ohio school buildings, charters represent 31% of the worst-performing reading buildings, 13% of the worst-performing math buildings, and 78% of the buildings with the worst graduation rates.
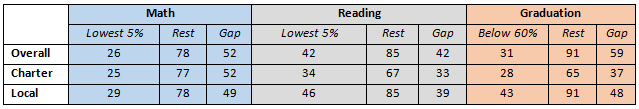
- Ohio’s achievement gap is 6% bigger in math, 8% bigger in reading and a whopping 23% bigger in graduation rates than they would be if the analysis only included local public schools.
- And while the state’s achievement gap is still too large, in all three cases, eliminating charters from the calculation drops Ohio’s achievement gap ranking. Math drops from second to fourth greatest. Reading falls from ninth to 11th And the state’s graduation rate gap tumbles from fourth to 14th highest.
- The achievement gap is greater in charter schools for math than it is in the local public schools
- The charter school achievement gap is narrower in reading and graduation rates because charters’ highest performers are so low performing overall compared with local public schools. For example, the average graduation rate for the 19 highest-performing charters – defined as those that have greater than 60% graduation rates (see “About the Analysis” below)– is 65%. Those 19 charters represent 17% of eligible charters. The average rate for the highest performing local schools – 96% of which have graduation rates greater than the 60% threshold – is 91%.
 About the Analysis: The White House report examined data from the 2012-2013 school year located at http://www2.ed.gov/about/inits/ed/edfacts/data-files/index.html on the web. Innovation Ohio was able to reproduce the White House calculations using the report’s methodology generally explained in its footnotes.
The White House calculated the achievement gap for reading and math by taking the average proficiency rate of the worst 5% of Title I buildings, then comparing that average with the average of the remaining non-Title I and Title I buildings. Because graduation rate reporting is more spotty, the White House calculated those rates by either doing a similar calculation as the proficiency rates, or taking the average graduation rate for Title I buildings below 60%, then comparing it with the average graduation rates for buildings over 60%. This final method is how Ohio’s graduation calculation appears to have been done because Innovation Ohio was able to duplicate the rates the White House reported using that methodology.
By way of interest, it also appears that while schools with non-numeric proficiency rates in the federal data (for example, “GE95” reported in the data set would mean greater than 95% proficiency. In order to duplicate the White House reported data, Innovation Ohio had to include these non-numerics as the numeric substitute, like the number 95 substituted for “GE95”), they did not do the same for graduation data. So there are, for example, several charter schools with graduation rates listed as less than 5% or less than 10% that don’t appear to be included in the White House’s calculation. If they had been, as they apparently were in the proficiency data, Ohio’s poorest-performing graduation rate would be far lower than the 31% reported.
About the Analysis: The White House report examined data from the 2012-2013 school year located at http://www2.ed.gov/about/inits/ed/edfacts/data-files/index.html on the web. Innovation Ohio was able to reproduce the White House calculations using the report’s methodology generally explained in its footnotes.
The White House calculated the achievement gap for reading and math by taking the average proficiency rate of the worst 5% of Title I buildings, then comparing that average with the average of the remaining non-Title I and Title I buildings. Because graduation rate reporting is more spotty, the White House calculated those rates by either doing a similar calculation as the proficiency rates, or taking the average graduation rate for Title I buildings below 60%, then comparing it with the average graduation rates for buildings over 60%. This final method is how Ohio’s graduation calculation appears to have been done because Innovation Ohio was able to duplicate the rates the White House reported using that methodology.
By way of interest, it also appears that while schools with non-numeric proficiency rates in the federal data (for example, “GE95” reported in the data set would mean greater than 95% proficiency. In order to duplicate the White House reported data, Innovation Ohio had to include these non-numerics as the numeric substitute, like the number 95 substituted for “GE95”), they did not do the same for graduation data. So there are, for example, several charter schools with graduation rates listed as less than 5% or less than 10% that don’t appear to be included in the White House’s calculation. If they had been, as they apparently were in the proficiency data, Ohio’s poorest-performing graduation rate would be far lower than the 31% reported.
Tagged in these Policy Areas: K-12 Education